The Ultimate Guide To Support And Resistance Trading
Whether you trade stocks, futures, or currencies – when it comes to trading successfully, support and resistance is one of the most powerful tools in your arsenal.
In this blog post I will give you a complete guide on how to use support and resistance for successful trading.
Support and resistance should be a part of any trading strategy.
Automatic Multi-Time Frame Support and Resistance Indicator
Inside “TheTradingBot” we have included a Multi-Time Frame Support and Resistance Indicator. This automatically adds the key areas based on higher time frames.
Turn it on with a simple checkbox, and the key levels will show automatically.
What are support and resistance levels?
Support Level
Support is a price level where buyers seem to show up and buy, while sellers are at the same time selling off their shares.
As prices fall for assets or securities, demand increases from people looking to purchase them instead of waiting until they hit rock bottom.
This creates “support lines” which will not let the asset’s share value drop down as low due to these new customers who want in on this bargain deal!
When a price reaches an established support level, it will either bounce back away from the area or continue in its direction before reaching another point of resistance.
Resistance Level
Meanwhile resistance zones arise when there has been an increase in pricing; after all it might be tempting if you’re already doing well but what about those investors who sell because they fear that things have gone too high?
Its all about supply and demand. Support areas are levels where there are more buyers willing to enter than sellers. Resistance areas are where there tends to be more sellers than buyers, often because of profit taking or the perception that the asset is over-bought.
What happens at these levels?
When prices reach areas of support and resistance levels they do one of two things:
1) “bounce” off this boundary returning to their original momentum;
2). If broken through by the market participants that are willing to take on more risk for higher profit margins these boundaries can be violated but offer limited opportunities as well.
Trading with Support and Resistance
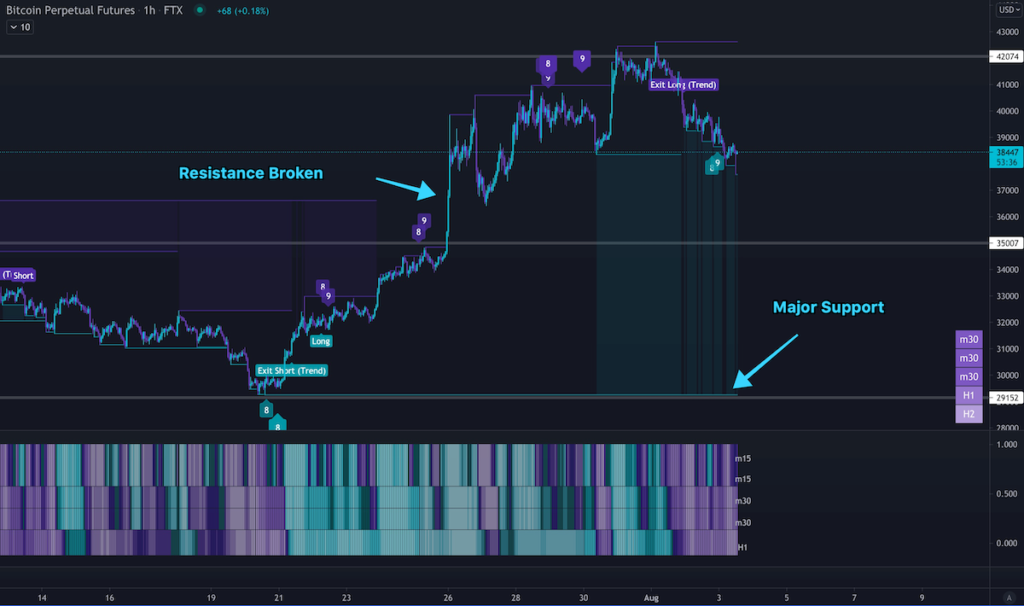
Support becomes resistance and vice-versa as price breaches the level.
If a key support level is broken to the downside, this area becomes resistance as price approaches from the bottom.
Think of these areas like walls. Some are stronger than others.
Strong areas can be identified by looking at higher time frames and observing how many times price reacts to the area.
The more touches to a resistance level the weaker the wall gets and will eventually break.
Common chart patterns around this concept is the double-top and double-bottom.
In both of these chart patterns, as price action reaches the area, it is rejected.
This is a 3rd or more attempt is typically successful.
Like skipping a stone across the water, eventually the stone breaks the surface and sinks.
Day Trading and Stop Loss Placement
Stop placement is often one of the more difficult trading decisions to make. Support levels are great areas for placing stops just below.
If you are shorting, you can place your stop above a key resistance level.
What time frame should you look at?
This depends on what type of trader you are.
For day trading, the support and resistance lines can be drawn on at least 15-minute timeframe. We find 1-2 hour easier to see the key levels.
A swing trader may use daily charts, while a position or day trader may use daily, weekly, or monthly charts.
Tip – In general, the lower the time frame, the less significant the technical analysis. Major swings on 1H chart are far more relevant than on a 1 minute chart.
Major Swings in price are where you can draw Support and Resistance lines
The first step is to identify the swing points. Major swings are also known as a pivot point.
– find support and resistances by drawing lines from these important areas of swing
– it’s best practice to look at resistance levels that have drawn out recent highs as well.
In tradingview you can use the keyboard shortcut “option + h” key to draw a horizontal line at major price swings.
You can also identify support and resistance in congestion, chop or accumulation areas which signify key price.
How do you identify points of support and resistance?
Knowing where these key areas are is the first step. The next thing you need to do is learn how they work by understanding their specific shapes, structures and patterns
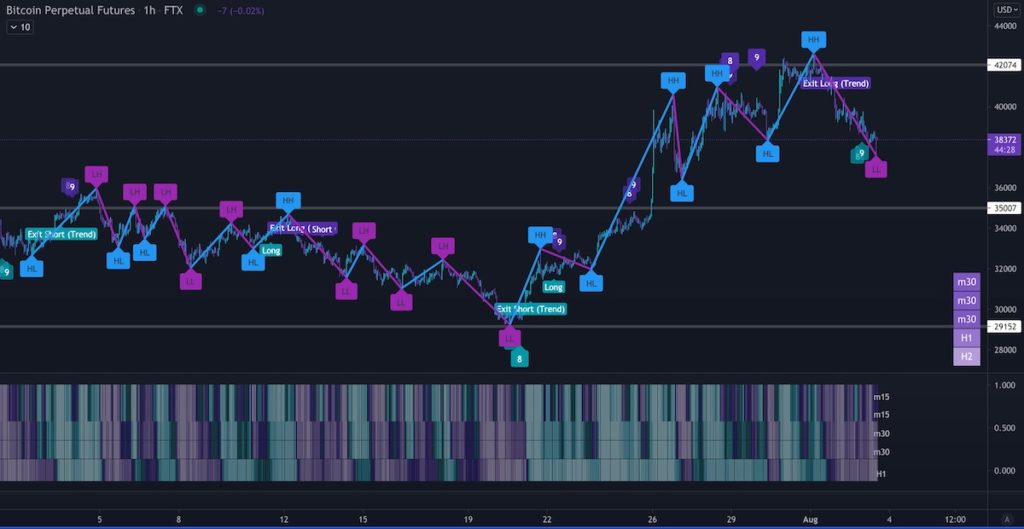
The easiest way to find these lines is to find major swings in price action.
A simple way to do this is to add a zig-zag indicator to your chart.
A zig-zag indicator draws straight lines between major swings.
We have a nice zig-zag indicator included in “TheTradingBot” you can use.
Use Renko Charts to remove the noise
We are big fans of the non time-based chart style called Renko.
What are Renko Charts?
Renko charts are a unique chart type that measure only price movements instead of both the benchmark and volume, like most other types. The origin word for this type is derived from Japanese – “renga” meaning brick – which appropriately enough, they’re made up by a series of bricks (or bars) with fluctuating prices determining when to add new ones onto the chart.
They can be created in various sizes beforehand by the user as desired; after you set it at what size you want your renkos to be on-screen or printed out, if there’s more than one predetermined movement within them then an entirely new bar will get added into play!
Renko charts make is very easy to see key support and resistance levels.
Using Renko for day trading can really remove the noise from the chart and also keep your emotions in check.
Volume Profile and POC (point of control) also a key area
Volume Profile is an advanced column charting study that displays trading activity over a specified time period at specified price levels.
The study (accounting for user defined parameters such as number of rows and time period) plots two histograms on the charts meant to reveal dominant and/or significant price levels based on volume.
Essentially, Volume Profile takes the total volume traded at a specific price level during the specified time period and divides it into either buy or sell volumes; then makes these totals easily visible to traders who want this information quickly available in order make decisions about which trade setups they should take advantage of most efficiently
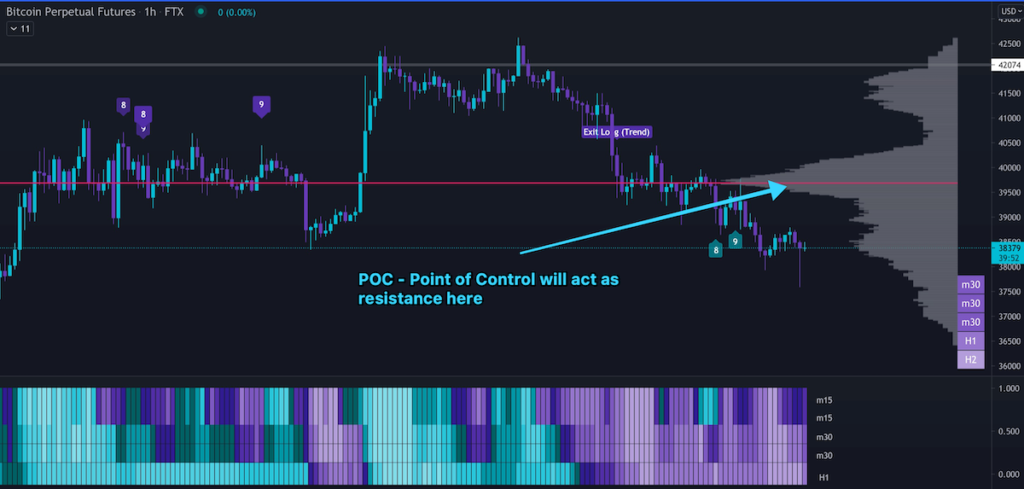
DEFINITION: Point Of Control (= POC) is a price level at which the heaviest volumes were traded.
The POC is the price level at which there are heavy amounts of volume traded. If you use Volume Profile only to find this price, then I dare say that you would be a better and more successful trader than 99% of all retail traders!
I’ve often wondered why Point of Control is so important and I’ll tell you the reason in a sec.
But first, let’s talk about POC for just a second…
POC shows where all that trading took place -where those huge positions were accumulated: The BIG guys-the big financial institutions like hedge funds, pension funds, banks etc.- are who accumulate them.
It’s no surprise then that they have such an influence on what goes down when it comes to our markets; which essentially means everything we buy or sell has some connection with their decisions at one point during its life cycle!
Moving Average can act as support and resistance
We’ve discussed using horizontal lines to mark support and resistance zones, which is great for identifying levels you might want to buy or sell at.
Moving averages can also act as support or resistance.
For instance, the 200-day moving average is often used by traders as a guide of long term trends in prices.
The 50-day line can also act as support or resistance – for example, if it has been holding up over recent weeks but breaks down now, this could be seen as a bearish signal.
Typically you want to use higher timeframes like 4 hour, daily, or weekly.
Add a simple moving average (SMA) or exponential moving average (EMA) to the chart. Change the period to match the price m until you find a period that price seems to bounce or reject from. The more points of contact the better.
Fibonacci Retracement to find confluence
One of the best ways to use Fibonacci retracement tool is to spot potential support and resistance levels. If those areas are already Fibonacci retracements, then combine them with other price points that a lot of traders watch, and it becomes much more likely for prices will bounce off these spots.
Common mistakes traders make when using support and resistance
Don’t make the mistake of trusting these areas too much. While these areas are respected as reversal zones, they are often broken. Once broken, they tend to lead to rapid price movement.
Basically, don’t assume price will reverse in these areas.