Examining TD Lines: a revolutionary indicator for trend trading by DeMark. TD lines indicator by Tom DeMark. Construction principles and conditions of use of TD demand line
Dear friends,
We go on getting acquainted with the methods of technical analysis developed and introduced by famous trader Tom DeMark. Today, our attention will be drawn to the rules of drawing TD points and TD trend lines. Also, we’ll learn to identify moments for opening profit-making trades and to calculate trade closure points.
A trend line is one of the simplest and widely used tools of technical analysis. But this tool is really subjective. If you gather a few traders in a room and ask them to draw trend lines, you may be sure about 2 things:
1) every trader will draw something unique
and
2) trend lines will be most often drawn on the basis of a trader’s subjective speculations, not on a real market situation.
Tom DeMark’s approach to drawing trend lines is absolutely objective and can fully exclude speculations from the decision-making process.
Just like with many other TD indicators, the theory of TD lines may be applied to any market on any time frame. So, this method is relevant to both intraday and long-term trading.
The key to drawing objective trend lines is a choice of correct points. DeMark says, an important moment in trend line drawing is to define reference points, i.e. levels which coincide with trend reversals.
The lower point’s value is surrounded by higher minimums from both sides while the upper point is surrounded by lower maximums. DeMark calls these points “TD points” and the lines which connect them — “TD Lines”.
Their values are ranged according to the number of surrounding maximums and minimums. For example, a maximum point surrounded by 5 lower maximums from both sides is called “Level Five TD Supply Point” while a minimum point surrounded by 3 higher minimums from both sides is Level Three TD Demand Point.
For drawing TD lines, you can choose any level TD point, but personally, I prefer Level 1 TD points as they are more sensitive to price changes than higher level TD points. As a result, they provide earlier signals of a trend breakout. However, we should follow TD Lines on different time frames and/or TD Lines of different levels because breakouts are more likely to happen when a few indicators point at them.
It’s worth noting that the author’s initials — TD (Tom DeMark) — should be mentioned when we are talking about DeMark’s analysis. Just because Tom DeMark’s patented all his inventions and demands that his name be mentioned each time his method of technical analysis is discussed.
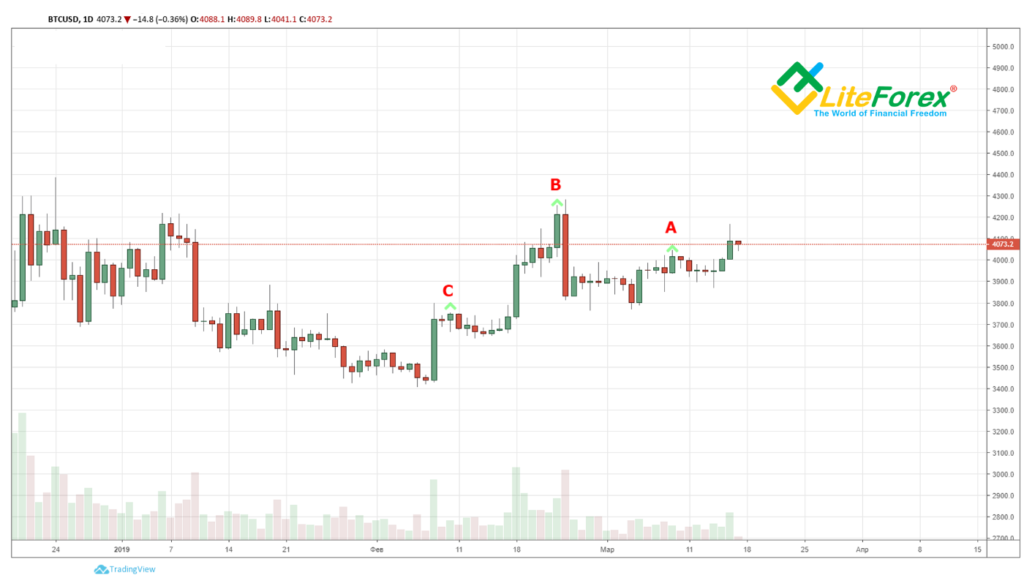
In the picture above, we see day candles marked with the letters A, B, and C. Each of these bars has the highest closing value among neighbouring candles. Thus, point A has 6 bars from both sides whose closing prices are lower. That’s why point A will be called Level 6 TD supply point. Then, point B is Level 12 TD supply point, and point C — Level 7 TD supply point. When identifying TD supply points, remember that these are closing prices that we need to consider.
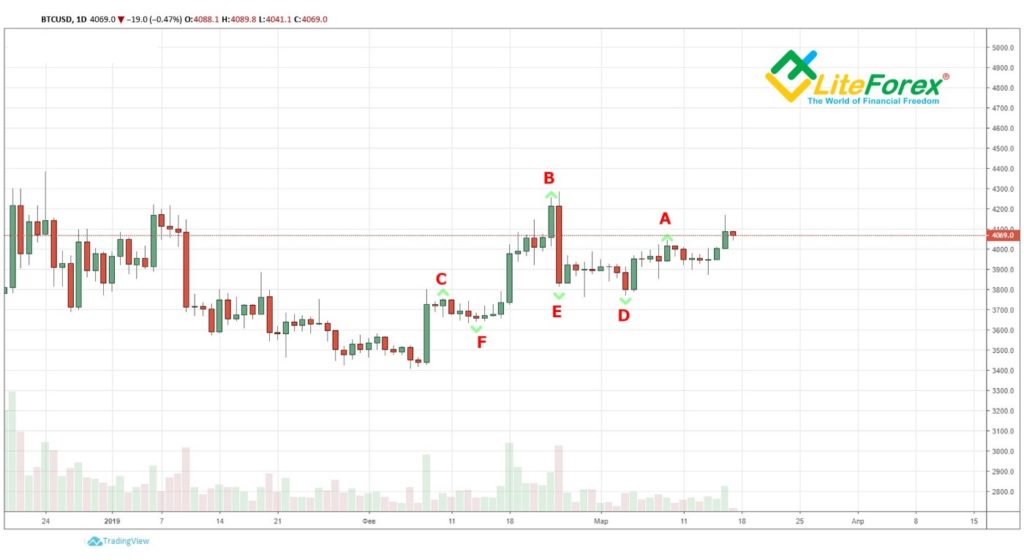
Let’s mark TD demand points with the letters D, E, and F. As you see, each of these points has the lowest closing price in the closest area. In this case, point D will be called Level 12 TD demand point. We see in the chart above that starting from February 18, 14 candles’ closing levels are lower than the D bar’s. But since the last closed daily candle on the right side is twelfth, we have to assign Level 12 to this TD point. As soon as the current daily candle closes and confirms its closing level above bar D, we can safely consider this candle to be Level 13 candle. If the same happens the next day, we will consider it as Level 14. Then this TD point will stop growing as there won’t be a 15th candle whose closing level will be above point D on the left side. Following the same calculation principle, you can easily find out by yourself that point E is Level 7 TD demand point and point F — Level 6 TD demand point.
However, TD points as such cannot prompt any useful information. They are mere extremums that we will use for drawing trend lines that Tom DeMark called “TD lines”.
For drawing TD lines, just like for drawing a traditional trend, only two points are required, but TD lines don’t require any confirmation and can be safely used in trading. Besides, to recognize the fact that the markets are a dynamic structure and the latest price change might be more important than past price fluctuations, TD lines shall be drawn using the 2 last TD points from right to left and not from left to right.
To define a support level and draw a TD support (demand) line , 2 last TD demand (support) points of the same levels should be connected (from right to left). To define a resistance level and draw a TD resistance (supply) line, connect 2 last TD supply (resistance) points of the same level from right to left.
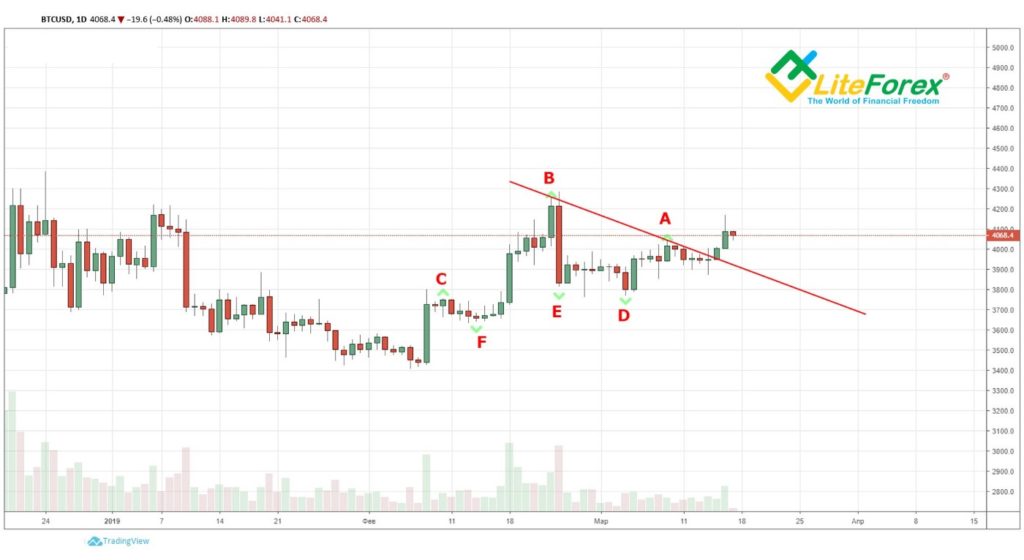
In our example, to draw a TD resistance (supply) line, we will draw a line through TD resistance points A and B. Examining the price movement, we see that the line was broken from below. It points to the start of a bullish trend, i.e. to price growth.
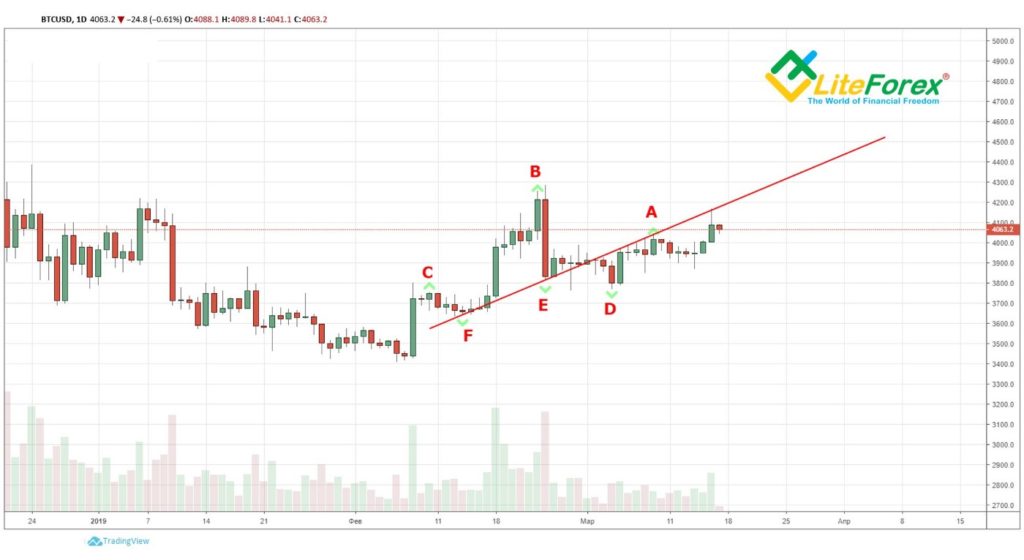
If we connect TD demand (support) points E and F from our example, we will get a TD support (demand) line. As you see, this line was broken, but there wasn’t a dramatic trend reversal, and the price continued its growth. Just like in classic technical analysis, support and resistance lines often change their meaning. In this case, a support line became a resistance line for the further price movement.
Since new TD supply and demand points will always appear in the chart as the trend develops, TD lines will be constantly updated, according to price changes. Thus, a trader will always understand in which trend the market is moving at the moment.
TD signals for making a trading decision
Having decided on how TD resistance and support lines should be drawn, DeMark worked out a number of rules relative to how the price should react to these levels.
He noticed that unexpected crossings of a trend line don’t often coincide with the direction of a breakout because a stop loss is triggered and trend/breakout traders often exaggerate forthcoming price movements.
And, vice versa, short-term breakouts, as a rule, don’t immediately end after a widely expected trend line crossing because trader holds positions before the breakout. DeMark differentiates between true (or solid) trend lines and false (or broken) trend lines. Using them, traders can open new positions in the direction of a true inside-bar breakout and cancel trades when a false inside-bar break of TD lines takes place.
Three qualifiers of TD demand (support) line
Once you’ve drawn a TD demand line, you need to wait until three conditions are satisfied to make sure that it’s time to open a new trade in the direction of a breakout.
Before one or a few conditions are met, you can expect a breakout inside the bar after which the price will go out beyond the limits of the breakout level.
Breakouts of a TD line which are confirmed by one or a few qualifiers are called “true” and serve as signals for opening a position to sell if a TD demand line is broken from above, and to buy if a TD supply line is broken from below.
If none of qualifiers has confirmed a breakout, the signal is considered as false and isn’t taken into account.
It’s very important to use these rules not to open loss-making trades especially if you’re a margin trader to whom a smallest mistake may bring huge losses.
TD demand line qualifier №1
Supposing that a price bar breaking a TD demand line from above is called “bar X”, you need to compare the closure of X-1 (price bar before a downward breakout) with the closure of X-2 (2 price bars before a downward breakout).
If the closing level of X-1 is higher than X-2’s, it’s highly possible that the X bar will close below the TD demand (support) line.
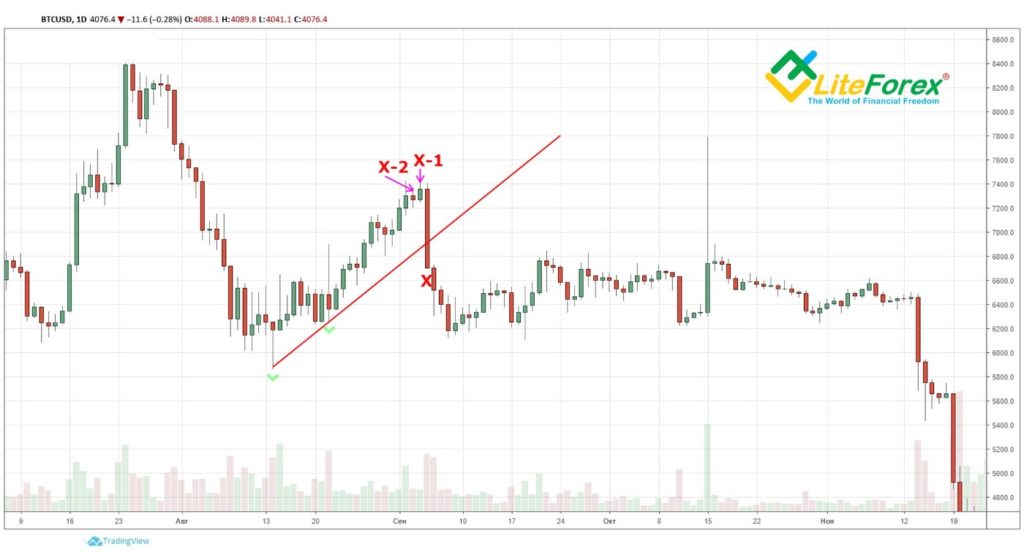
As we can see in the picture above, the closing price X-1 is higher than X-2. Based on these data, we may suppose that a resistance breakout made by bar X will be true and open a trade at a price below the breakout point, without waiting for the closure of candle X. As you can see, the price went sharply down, which confirmed the validity of the breakout.
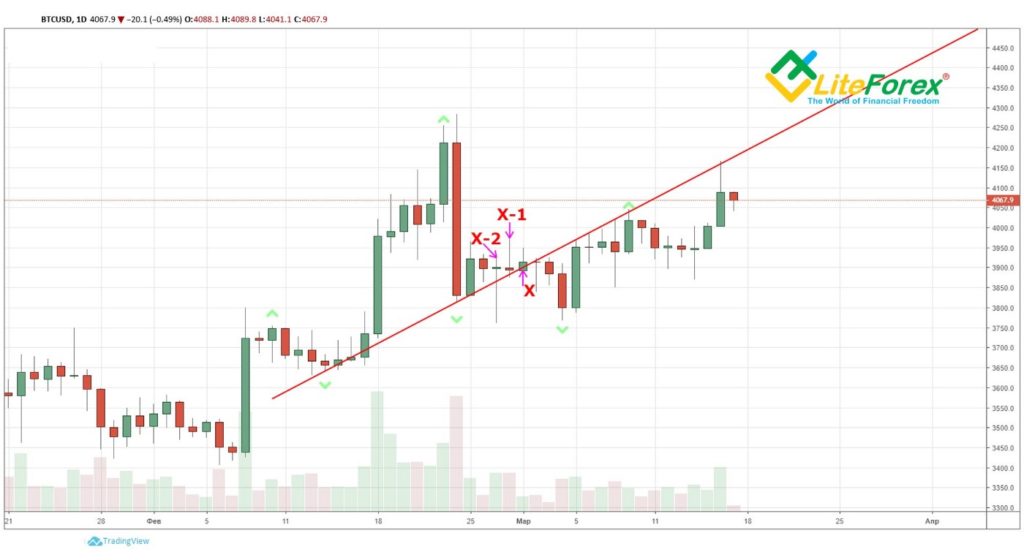
The picture above shows that the closing price X-1 is lower than X-2. Based on these data, we may suppose that the breakout of resistance made by bar X will be false. In this case, we’d better refrain from short positions.
The reason is that a higher closure of a candle before a downward breakout of the TD demand line indicates the crowd’s bullish sentiment. If even a relatively small market fall takes place, it puts stronger psychological pressure on the bulls making them close their long positions. At the same time, the bears will open new short positions more willingly and thus increase the chance of closing below the TD demand line.
Conversely, if a candle which precedes a fall has already updated its closing point minimum level, it means that a big part of market participants are getting ready for a fall and aren’t sure about long positions. As a result, a breakout is more likely to be false as panic sales are hardly probable and the bulls will easily claw back such a fall.
At the same time, if you see that a bar has closed downwards before a breakout of the lower limit of the TD demand line, you don’t need to consider an inside-bar breakout of the TD demand line, expecting that the market would close above it again.
TD demand line qualifier №2
If a breakout candle closes under the TD demand line, it says that new sale pressure has shifted the demand/supply ratio in favour of the bears in the medium term. In this case, DeMark will consider the breakout as true.
This signal is usually used in combination with the previous one. Based on my personal experience, I can say that a false signal probability rises if you use this classifier alone.
If two conditions above haven’t been observed, you can use one final qualifier to measure the pressure of sales, i.e. supply, before the lower limit of the TD demand line is broken.
TD demand line qualifier №3
1. Projecting a breakout of bar X, identify the price bar before a breakout of the TD demand line (X-1) and calculate the difference between the closure of this bar and the biggest value out of two following values:
- The high of this bar;
- The closure of the previous bar (closure X-2);
2. Then, subtract this value from the closure price X-1 and if the result is above the breakout point of the TD demand line, we will get a signal to sell at the inside-bar breakout of the TD demand line, expecting the market to close below it.
If the result of subtraction is below the breakout point of the TD demand line, then the breakout is considered as false and is less likely to grow at closure.
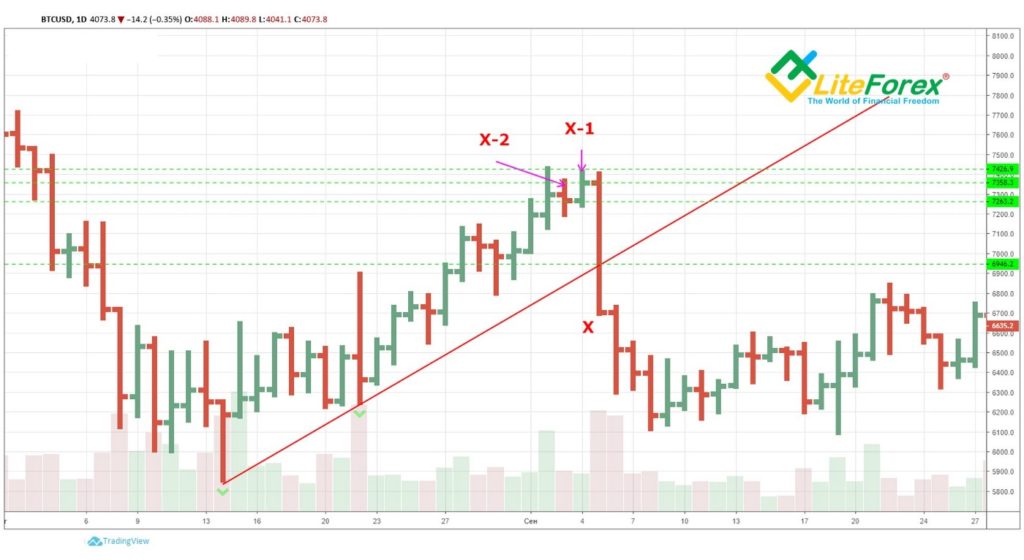
Here’s an example of calculation.
The high of bar X-1 equals 7426 and the closure price of the previous bar X-2 equals 7263. For calculation, we’ll take the price of bar X-1’s high as it’s bigger than the closure price X-2.
The closure price X-1 equals 7358.
7426–7358=68. It’s the difference we get at the first calculation stage.
Then we subtract this value from the closure price X-1 and we get 7290 (7358–68=7290).
The breakout point of the TD demand line is at 6846 in our case.
As you see, the calculation result is above the breakout point of the TD demand line, that’s why a demand line breakout may be considered as true if candle X makes it under such conditions.
Target calculation at a breakout of TD demand (support) line
You must remember from your school physics course that for every action, there is an equal and opposite reaction. But DeMark asserts that this law can be also applied to markets, where symmetry is often present. Price movements above the TD demand line are often copied under it after a true downward breakout.
Determining a target at a true breakout of TD demand line
- You need to identify the highest true price maximum above the TD demand line and draw a perpendicular line under the TD demand line in the breakout area.
- Subtract the length of this perpendicular from the point where a true breakout took place and you’ll get an exit point.
The target will remain the same until a true upward breakout takes place. In this case, the demand/supply ratio will be shifted or the breakout target of the descending trend line will be reached.
Now, when you’ve entered a short positions after a true inside-bar descending breakout of the TD demand line, you need to take some actions which will lead you out from this position if something goes wrong.
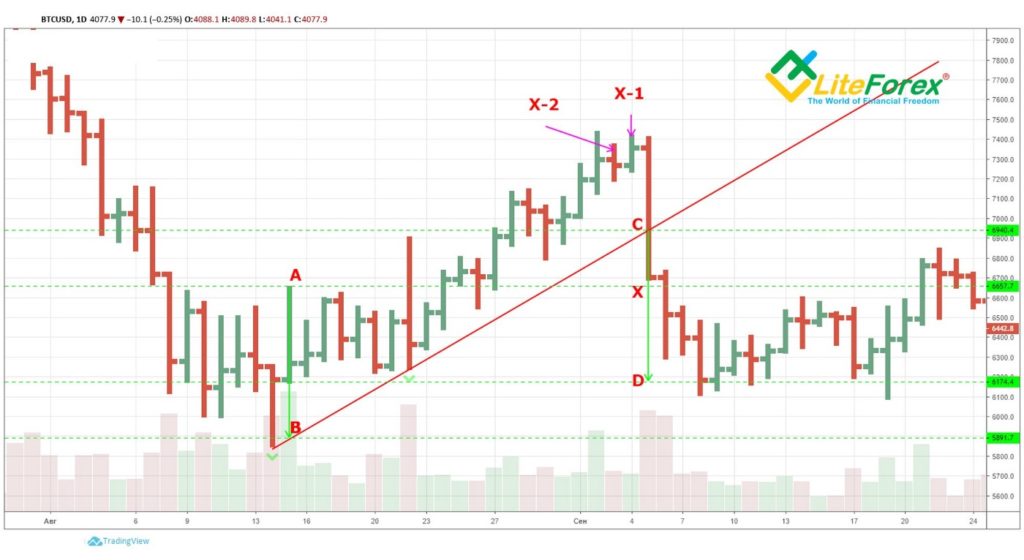
Let’s examine the example above.
The highest price above the breakout line is a segment marked as AB. Its value equals 6657–5891=766.
Subtracting its value from the breakout point, we get 6940–766=6174.
As we can see in the chart above, the price forecast proved to be correct, and if we’d opened a position a bit below the TD demand line breakout point — at 6900, for instance, — we could earn 726 points of profit.
Exiting a short position by use of TD demand line
There exist 3 rules for closing a short position after an unsuccessful breakout of the TD demand line:
- If the opening price of a candle right after a downward breakout is above the breakout level, you should exit at the opening price of the candle.
- If the opening price of a candle right after a downward breakout is above the breakout level and the candle closes above the breakout level of the TD demand line, you should exit at the closing price of the candle.
- If the low of the candle coming next after the breakout of TD demand line cannot fix the price below the candle’s low at the moment of breakout, you should exit at the closing price of the candle.
We will continue examining Tom DeMark’s tools in our next articles, paying attention to TD supply line and connected signals.
That’s all for now. Another article devoted to Tom DeMark’s indicator that we applied to BTCUSD is ready. I hope it is useful and interesting for you.